


Password Reset
Forgot your password? Enter the email address you used to create your account to initiate a password reset.


Forgot your password? Enter the email address you used to create your account to initiate a password reset.
10 Minutes
Within any health care system, on any given day, in any department or division, vast quantities and categories of data — patient, disease, procedure, insurance, operations, quality — accumulate nonstop. There is an inherent power within this accumulation of information which can be used to transform and improve upon countless aspects of the provision of medicine.
However, the transformative nature and insights of this information are only as useful as a system’s ability is to harness it, make it accessible, and deliver it in a consumable manner that can be used to drive decision-making that will ultimately create a higher value of health care with improved outcomes at lower costs.
As a system, UPMC has invested years of effort to make this reality possible. Oscar Marroquin, MD, FACC, is a cardiologist and epidemiologist by training. In his current role as the Chief Clinical Analytics Officer for UPMC, he is responsible for managing a team of analysts and data scientists whose mission is to derive insights from the vast collection of data generated when care is delivered to patients, and make these insights and information available to clinical and administrative leadership across the system.
In this interview, Dr. Marroquin provides some of the context, challenges, and successes his team at UPMC has had in providing data insights and tools to help transform how medicine is practiced locally, and as a model for other like-minded institutions pursuing similar objectives.
Q: What are some of the driving factors at UPMC with respect to how it captures and uses all of the health care data generated across the system?
A: UPMC has created and promoted a culture where analytics are embedded into the fabric of the decision-making process, systemically, in cardiology, and all of our specialty and subspecialty practices. We have been successful in making the data that we have more liquid, meaning that it is accessible, transparent, and consumable. This allows leadership across the system to then use this information to drive their decision-making and planning processes in ways we were unable to do in the past. Leadership within UPMC saw the importance and power within analytics many years ago and made conscious decisions to invest heavily in our ability to render the data we collect useful in ways that can fundamentally improve upon direct patient care and related outcomes. In essence, we decided as a system to become more introspective.
Q: Broadly speaking, what is your analytics team responsible for at UPMC?
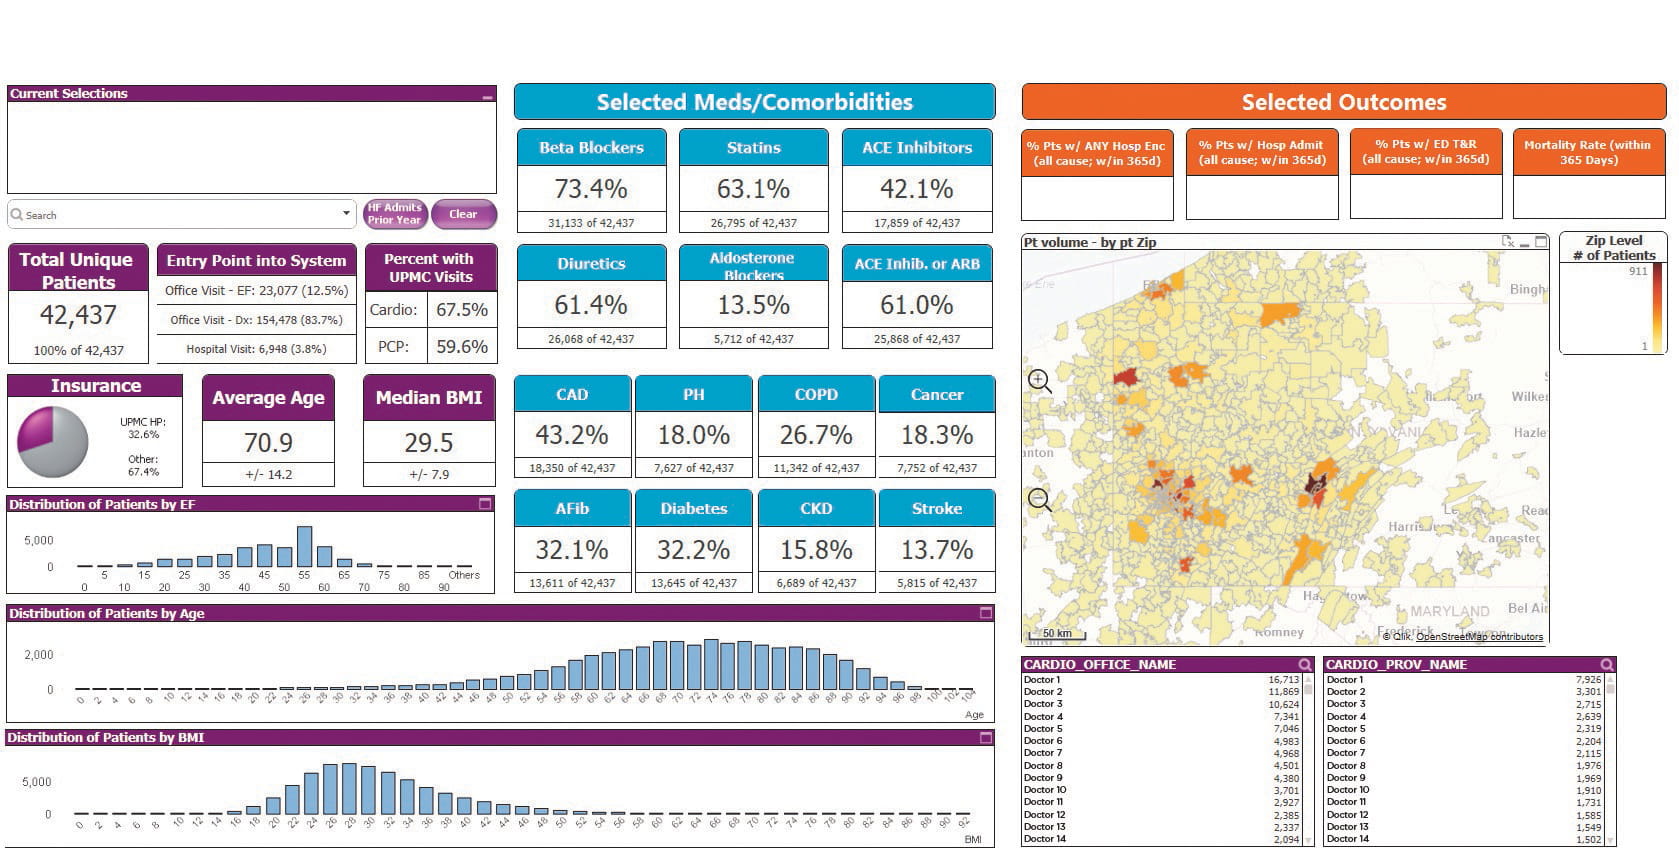
A: There are three main areas of work that our group is engaged in across the system. The first is what I refer to as tool-building to facilitate data exploration and discovery. I can illustrate this concept with a recent project (Figure 1) with the UPMC Heart and Vascular Institute (HVI). This group, led by Joon Lee, MD, has been an early and enthusiastic adopter of our work and a great partner in helping us develop tools and insights that will affect a real and lasting change with their patients. First, a question is posed: Can we identify more advanced heart failure patients that would be good candidates for a transplant before they progress to a point where a transplant is no longer an option? To answer this question, we needed to start by doing exploration and discovery of our data. This allowed us to identify who are the heart failure patients at highest risk of poor outcomes. We analyze what these outcomes look like; are these patients being treated appropriately or not? This then becomes our foundation to understand how big the problem is across the system, how these patients are doing clinically, and how we then may be able to build a program around this population to optimize health and outcomes.
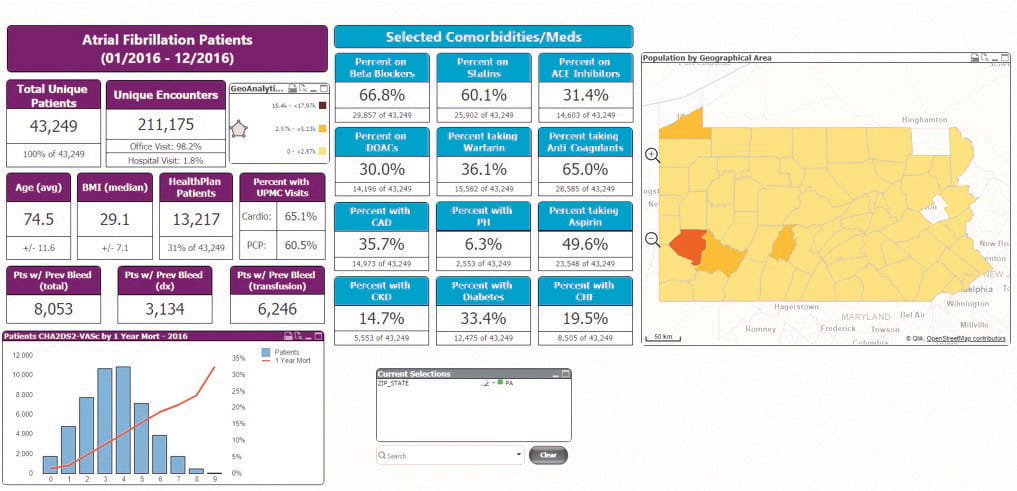
Pivoting off this exploration and discovery work, our team is responsible for building applications; sometimes I describe them as interactive dashboards, that allow clinicians and administrators to interact with the data, learn from it, and use it to improve clinical practice in some way. This is where the aspects of data liquidity — accessible, transparent, consumable — become vitally important. It is at this level of interaction through our interactive dashboards that clinical leadership can analyze the information and do so quickly, in ways that portray the resulting information immediately understandable. I will illustrate this with another example from the UPMC HVI: UPMC HVI leadership wanted to better understand the population of atrial fibrillation patients to see if improvements can be made in their care through the creation of an AFib center of excellence. Naturally, you first need to find who are the AFib patients across the system and how many there are. Through this dashboard that we built (Figure 2), we could identify 44,000 unique patients at UPMC currently in treatment for a diagnosis of AFib. Through our analytics tool, we can see that approximately 70 percent of these individuals are being treated appropriately with some anticoagulation therapy. That leaves a significant percentage of individuals who may not be getting the best care to minimize their stroke risk. Our tool can very efficiently find these individuals, thereby allowing clinicians at the HVI to narrowly define a target population for some follow-up, intervention, or program based on all of their clinical data and needs. To do that in the past, someone would have had to request a static report, wait for it to be developed, and it would likely not have had much transparency to more than a few data domains that would have reached only a handful of people in the system. The power of the tools that we’ve built is that they address most (if not all) of these issues: they are readily available, they are interactive (which allows users to ask the next questions), and are easily deployed to larger numbers of end-users in the organization. The following example illustrates these points.
The third area our group has a focus on is the creation of predictive models that can be used by clinical providers to enhance clinical decision-making when managing complicated or multifaceted conditions. We have created a number of these for different areas and are actively working on a predictive model for congestive heart failure patients. It would provide innumerable benefits to leadership at HVI if they could gauge in advance which patients are likely to deteriorate quickly, over a given period; which ones may be at risk for increased hospitalizations; or who is at highest risk for adverse outcomes in the next 12 months. The model we are building will allow a doctor, in real-time, based on the patient’s medical history, to see in which cluster of risk is the patient, which would then have an accompanying suggestion of plans of care to meet such stratified needs.
All of this work brings us back to the adage that the right patient gets the right care at the right time. That is an approach that leads to better outcomes. Our tools can make that process much faster, more accurate, and easier to deliver in real-time, or as close to real-time, as possible.
Q: How many tools, applications, and interactive dashboards have you created for use across UPMC at this point?
A: At the time of publication, we have 84 apps in production and many more in the development pipeline. Some of them are condition-specific like our AFib and heart failure tools that HVI leadership is using. Some are system-level tools, like our office visit app that can drill down into every face-to-face encounter within UPMC ocurring in the last four years, and branch off into other areas. Again, the reason we can do this is we have taken great pains as a system to catalog and manage our data specifically for use in analytics platforms.
Q: Do you have an example of how one of your tools or applications has led to new questions, new hypothesis, new uses of the underlying data architecture, or how great a level of detail you can drill down to in the data to ask and answer questions?
A: I always tell people one of our biggest tasks as a department is to use the tools that we have available now for data visualization, allowing clinical leadership to explore the data and discover insights. From that exercise of exploration and discovery often will come hypothesis. Our AFib tool is a good example. While there is not an unlimited number of questions you can ask and answer with the data sets available, it does allow users to go five or six levels in and pick at specific aspects of the condition or its management.
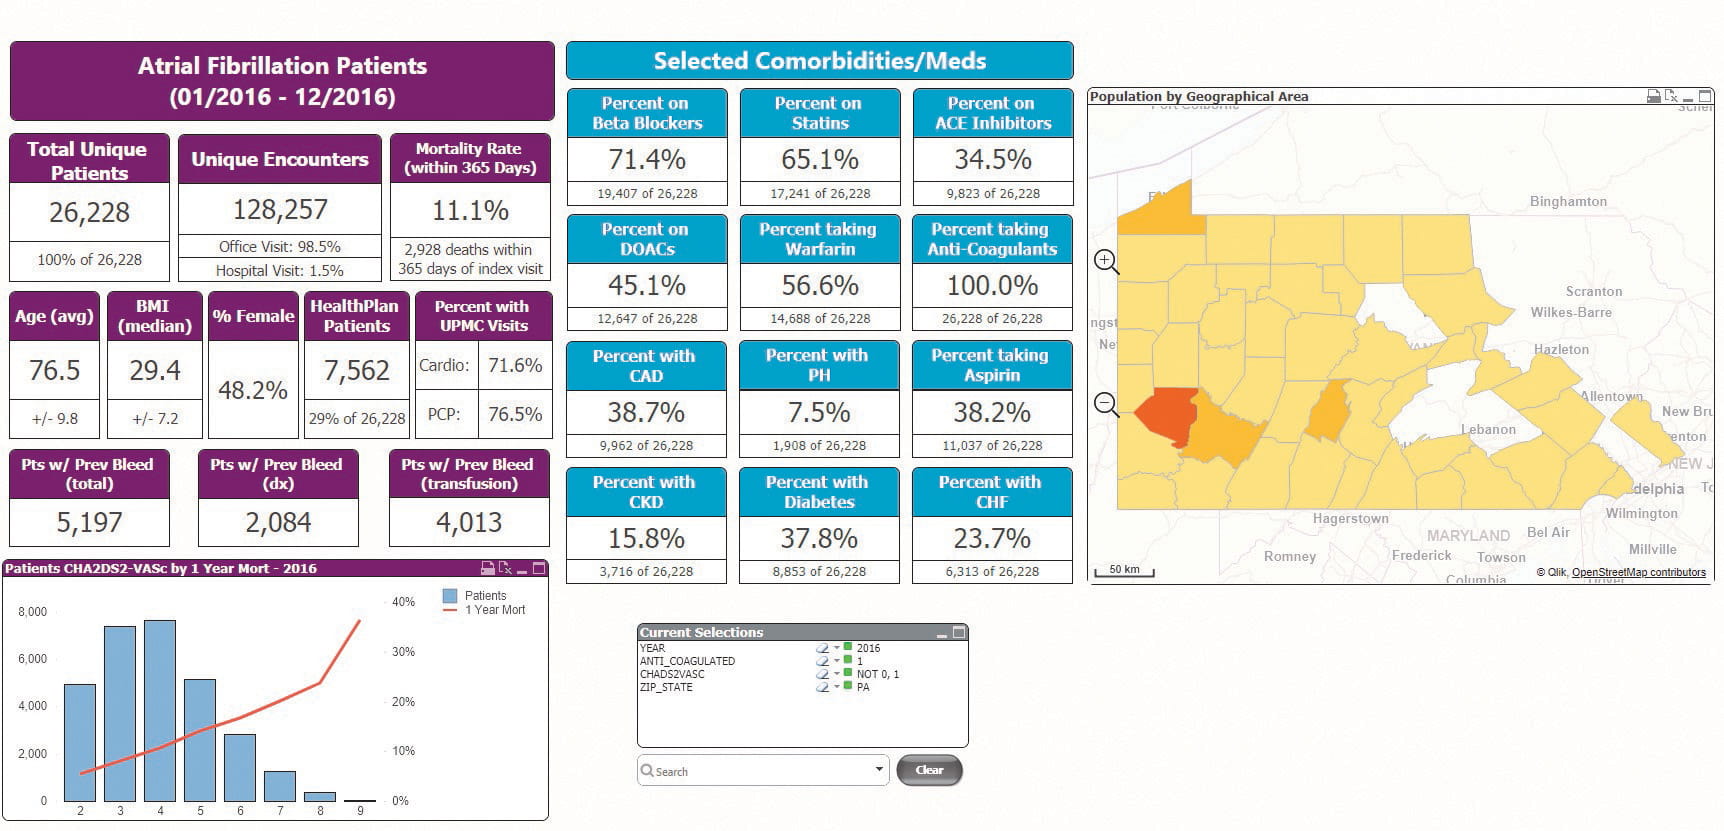
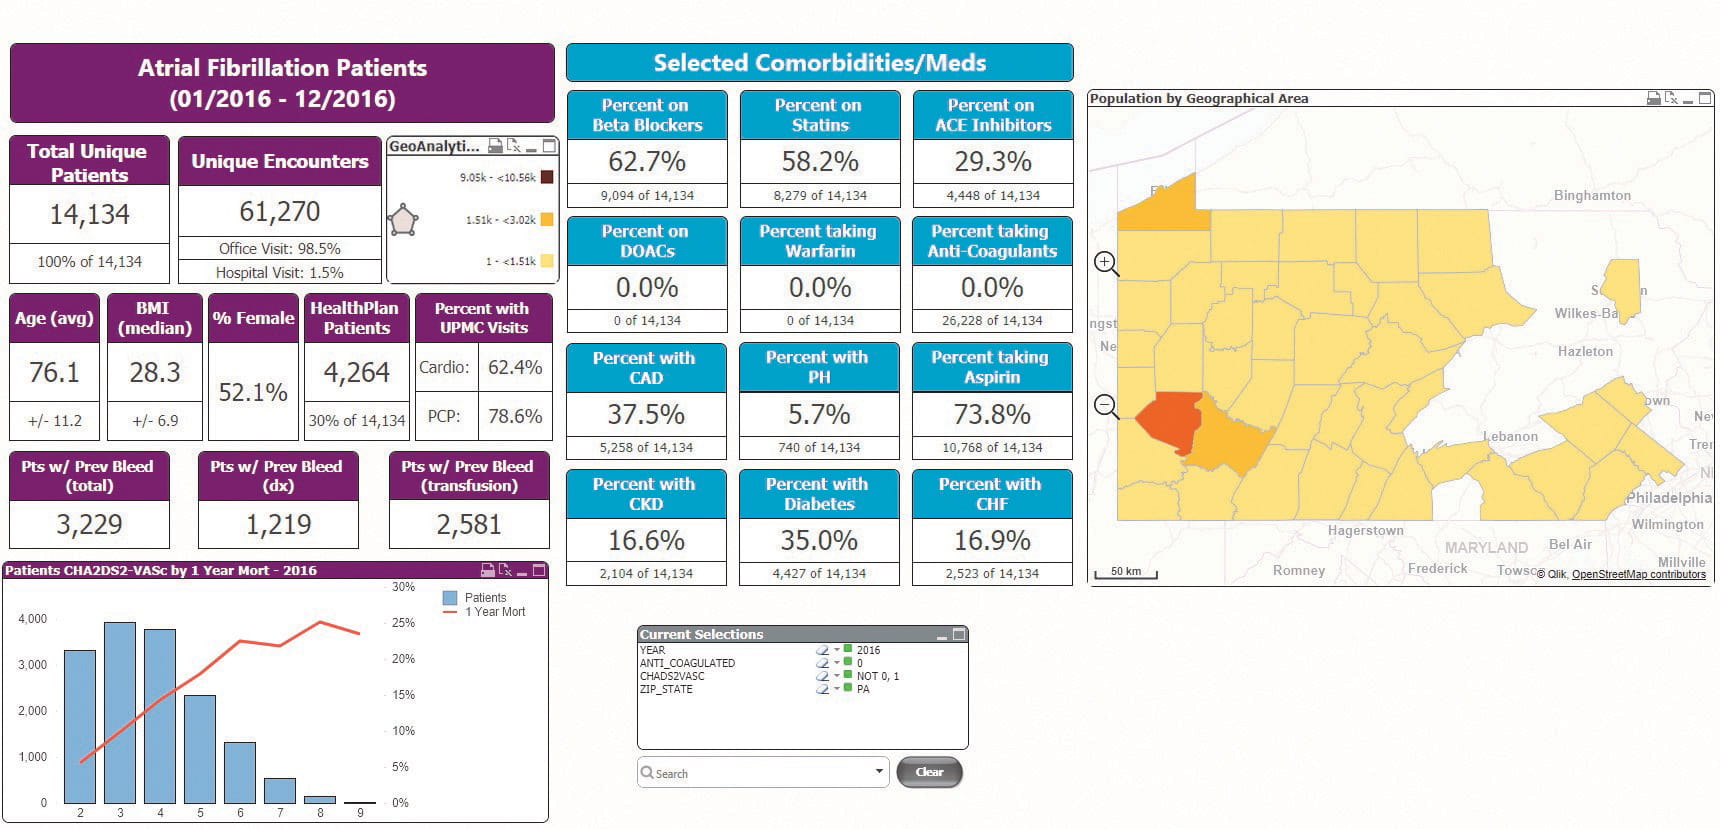
We can analyze the Afib patient population in virtually any time frame — one month, one year, three years. We can find just those patients who are UPMC Health Plan members or those that are Medicare subscribers. We can look at the population by geography. For patient characteristics, you can analyze the population by obesity rates, age, ejection fraction, and CHADS2-VASc scores. We can see who are and are not good candidates for anticoagulation therapy. Perhaps some of those with a bleeding history may be right for a left atrial appendage closure device.
Outcomes are part of the metrics as well, and importantly so. Stroke rates, hospitalizations, and mortalities are all selectable outcomes. Looking at the data on Afib patients through such a tool can help HVI clinicians understand their population as well as the impact that their actions have on outcomes; and for the leadership group, it can be utilized to plan for how to build a program to manage these patients at a system level. This can allow for better staffing to handle what the real need is.
One thing that is very important to remember: these are all tools. They are not designed to, nor would we want them to be, substitutes for clinical judgment. They are tools to help guide the decision-making process with as robust, accurate, and detailed information as we can extract from our systems. That same sentiment should be applied to the predictive models we create. They are designed as assets that enhance and facilitate clinical decision-making by clinicians as we strive to deliver more personalized medicine.
The UPMC Heart and Vascular Institute provides comprehensive cardiovascular care for patients and is helping to advance the field and improve patient outcomes through research.
• The Cardiology Division is one of the nation’s largest, with more than 130 cardiologists and 100 PA/CRNPs who span over 20 hospital sites and 40 office locations. Our high-volume practice encompasses more than 23,000 diagnostic and interventional procedures per year, and the experts in our Center for Aortic Valve Disease have performed more than 1,300 transcatheter aortic valve replacement (TAVR) procedures to date.
• The Cardiac Surgery Division provides a multidisciplinary approach to patient care in an environment that fosters the development and evaluation of innovative surgical techniques and therapies. Our staff, which includes more than 20 cardiac surgeons, are committed to clinical excellence as well as scientific inquiry, and represent a broad range of expertise in cardiothoracic surgical procedures.
• The Vascular Surgery Division of the UPMC Heart and Vascular Institute offers comprehensive arterial, endovascular, and venous care by a team of vascular experts. These professionals work together in the study, development, and implementation of new procedures and devices to deliver advanced, comprehensive vascular care. The surgeons of the Vascular Surgery Division specialize in minimally invasive procedures, which many of our faculty helped to pioneer for the treatment of the entire vascular system.
To learn more about the UPMC Heart and Vascular Institute, please visit UPMCPhysicianResources.com/Heart.
